RWi Draft Guide: QB Comparison Graphs
2013 Fantasy Draft Intelligence: Top 15 QB Comparative Analysis
Byron Lambert, Rosterwatch.com
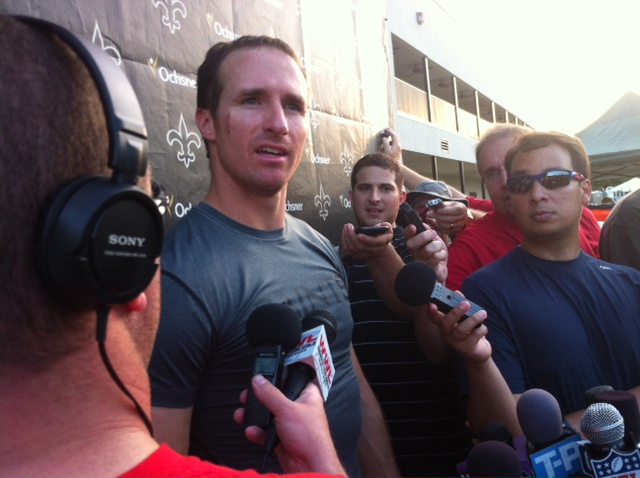
Photo by Alex Dunlap, Rosterwatch.com
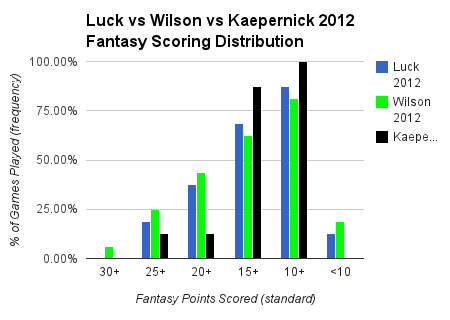
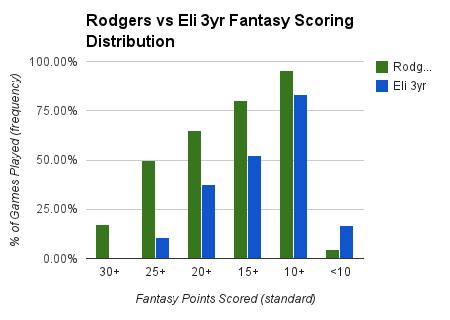
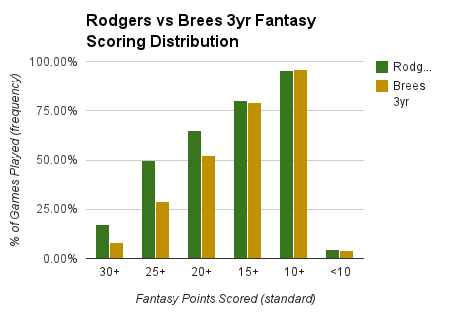
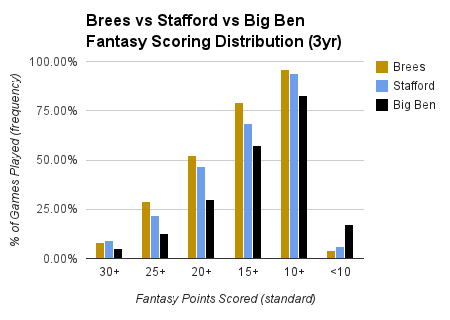
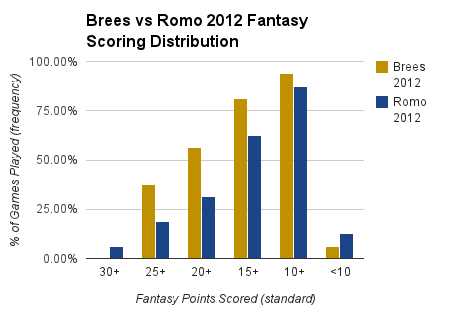
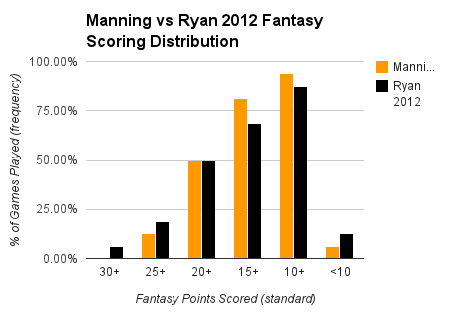
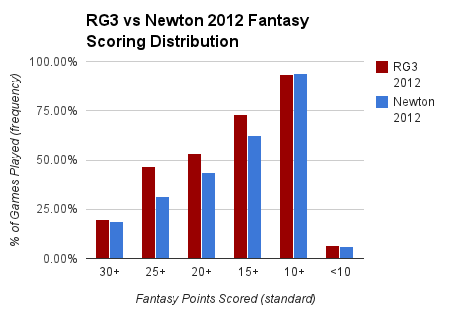
For visual interpretation we have provided several comparative quarterback graphs. They are based on the fantasy scoring distribution of the various players included, in 2012 and over the last three seasons. The data tells us how often certain players produce at certain levels. The trade-offs between the different options are evident here. It’s the sort of opportunity-cost that fantasy players should be conscious of as they mine for value in upcoming drafts.
* These charts are read- “Over the last three seasons, Eli Manning has scored 15+ pts 50% of the time- and Aaron Rodgers has done it over 75% of the time”
Rodgers vs Manning 3yr
Rodgers vs Brees 3yr
Brees vs Stafford vs Big Ben 3yr
Brees vs Romo 2012
Manning vs Ryan 2012
RG3 vs Newton 2012
Luck vs Wilson vs Kaepernick 2012