RWi RosterWatch Week 3 Matchup Tool
RosterWatch Week 3 Matchup Tool
Alex Dunlap, Rosterwatch.com
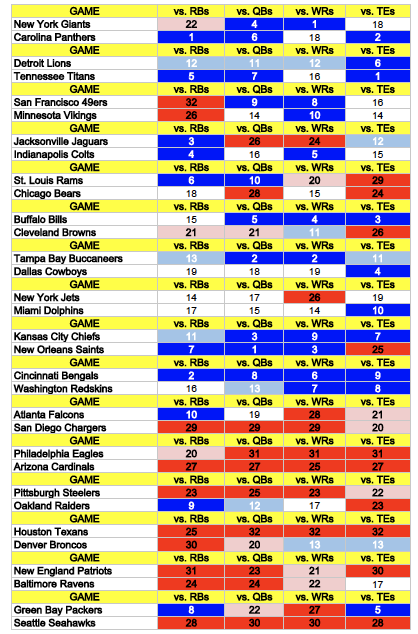
This is a decision-making, fantasy tie-breaker tool to help you judge the weekly matchups your fantasy players face. Teams are ranked from 1-32 versus the RB, QB, WR and TE positions. A ranking of “1” is the most friendly to an opposing player, while the ranking of “32” is the worst.
When you use the tool, find the team that your player plays on, then look at the opponent’s matchup rating against the position in question.
We have highlighted the top 10 best positional matchups in BLUE.
Fringe-top tier matchups are highlighted in LIGHT BLUE.
Fringe-bottom tier matchups are highlighted in LIGHT RED.
The top 10 toughest matchups for opposing fantasy players are higlighted in RED.
Method:
Upon arriving at Week 5 of the NFL season, all of the data we use as inputs for this tool will come from the 2012 season. At this point in time, we will have a solid baseline from which to base projections completely moving forward.
Since we are not afforded the luxury of an established 2012 fantasy points against baseline for 2012 to look back on in Week 3, we have employed our system of weighted averages to construct the following hierarchy.
Matchup rankings take into account a number of variables, and are derived via a proprietary RosterWatch algorithm. One portion consists of six variables from 2011, while the rest is comprised of scouting/analysis grades of each defensive team’s 2012 starting positional group when taken as an average. Starting in Week 2, we also take into account Week 1 fantasy performances against and Week 1 collective unit grades based on each player’s personal grade when in run defense and coverage.
Meaning, for example, for TE matchups: We will look at 2011 fantasy points allowed per game by the team on average to fantasy TEs.
We then make adjustments for new personnel, and/or scheme. A grade in this case will be assigned to those who will generally cover the TE. (3-4 ILBs, 4-3 LBs, Safeties and Nickel Corners.) We call this variable the TECP or tight end coverage personnel variable. We then get an average for that group’s scores and use it as an input along with a small bit of credence given to preseason performance in snaps vs. No.1 offenses as well as Weeks 1 and 2.
+Based on Standard Scoring
++RW Proprietary Algorithm

2 Comments
Leave a Reply
You must be logged in to post a comment.


Pretty useful little graph. How are the numbers figured out?
Saints gave up the 9th most points to QBs last year and 3rd most this year, but they are easiest matchup for QBs in this graph. Does that mean matchups/schedule are taken into account? Or roster changes?
Hey Josh, thanks for coming by. It is our proprietary algorithm to start the season. We take into account this year, last year in FPG/allowed then use weighted variables to account for changes in scheme and personnel. We also chart the 2012 pass rush/coverage/run defense grades of defensive starters along each unit to serve as a real-life baseline against the numbers to make up for outliers.