RWi Week 12 WR Touchdown Dependency
Week 12 WR Touchdown Dependency
Byron Lambert, Rosterwatch.com

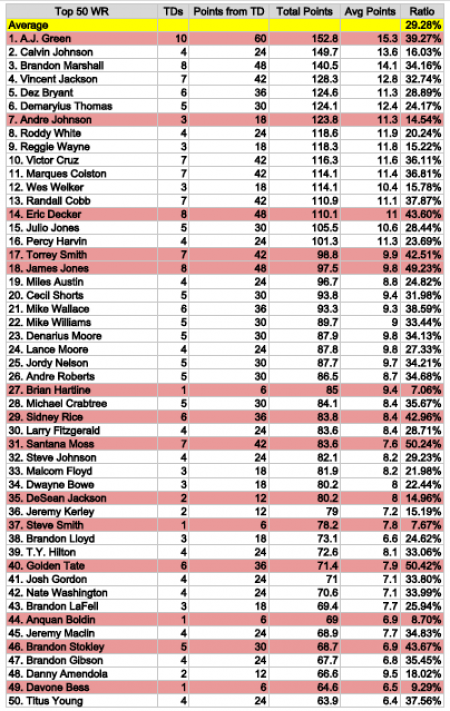
We’ve already noted that the running backs have settled in. For the receivers, it’s interesting to see the average slowly and continuously creeping up towards 30%. Over time the receiver average has diverged upward from that of the fantasy running back. It makes sense, receivers get less touches but still a lot of scoring opportunities. The volatility created by this difference in touchdown dependency between positions gives credence to the traditional school of thought that running backs are more valued commodities than receivers. They are more reliable.
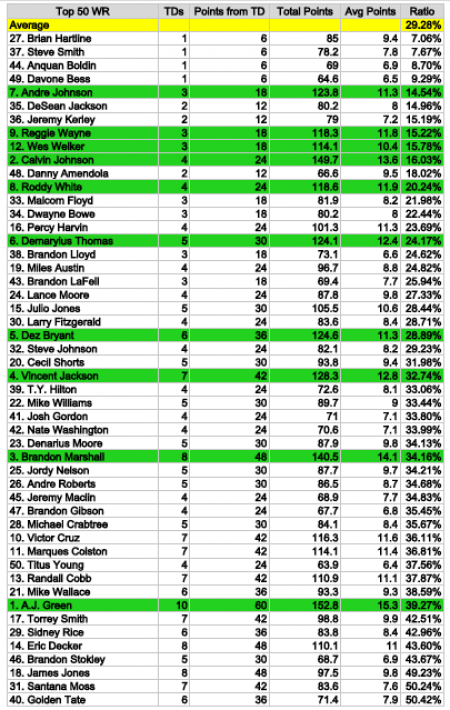
I was highlighting key players in these charts when I also noticed that the ratios for receivers continue to be much more scattered. I’m not surprised. That said, there is a group of players in Chart 2 in the 15%-35% range that are completely locked in.
+Chart 1 (Sorted x Total Points) – Players in red have ratios way off of the average for one reason or another. Each of these players must be considered within the full context of his respective situation.
++Chart 2 (Sorted x Ascending Ratio) – Players in green are the creme de la creme of this test.


