RWi Week 8 RB Touchdown Dependency Ratios
Week 8 RB Touchdown Dependency
Byron Lambert, Rosterwatch.com

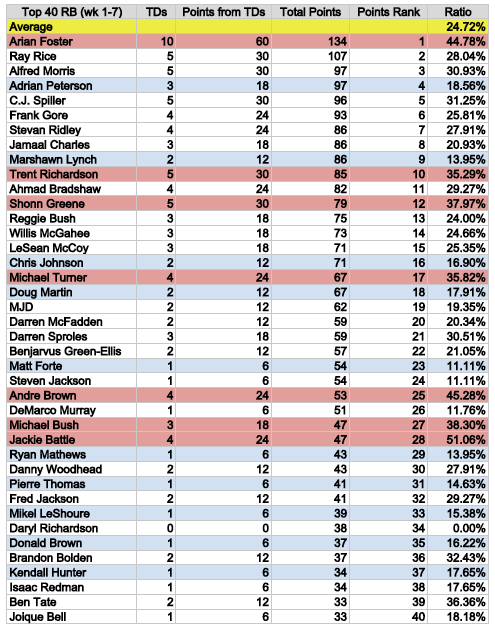
We are holding pretty steady now, in the 24 percent range, regarding the average level of running back touchdown production versus total fantasy points. As always, I’ve arranged the data two different ways. The first chart is sorted by total points on the season. Here I focus most on the deviation from average, spotlighting ratios that are significantly off the mean.
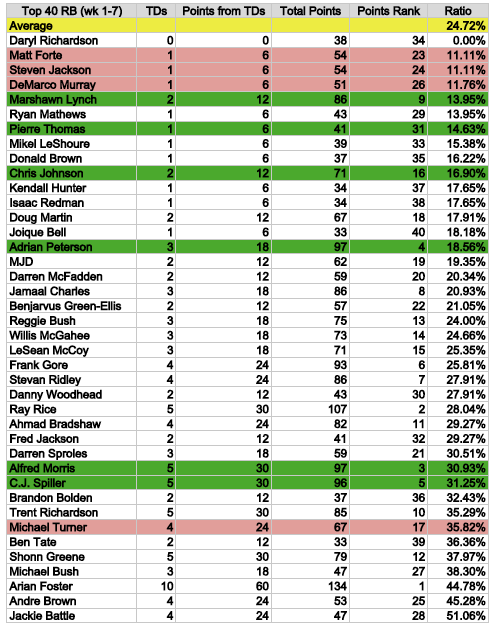
The second chart is sorted by ascending dependency ratio. I tend to look at these results as more of a snapshot of value based on production and expectations. Players have been highlighted accordingly. Remember, in some cases a low ratio indicates relative deficiency.
For the most part though, a lower ratio is indicative of future consistency and upside. A high ratio signals potential inconsistency, and a possible swoon in value. In both charts it’s red that indicates some concern. Players highlighted in red are oftentimes great sell high candidates.


